
Summary Statistics
Calculate per-file channel statistics and add the results to the sample table.
7. Summary Statistics
Calculate Statistics opens a window where you can pick any loaded channel and one or more statistics — Mean, Std Dev, Median, Min, Max, or All — computed per file across every loaded sample (not just checked rows).
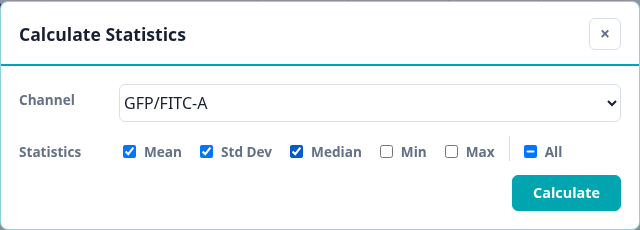
Click Calculate to run the selected statistics. A progress bar appears in the Calculate Statistics window while PhaseFinder loads any needed channel data; files already loaded for plotting reuse their cached data.
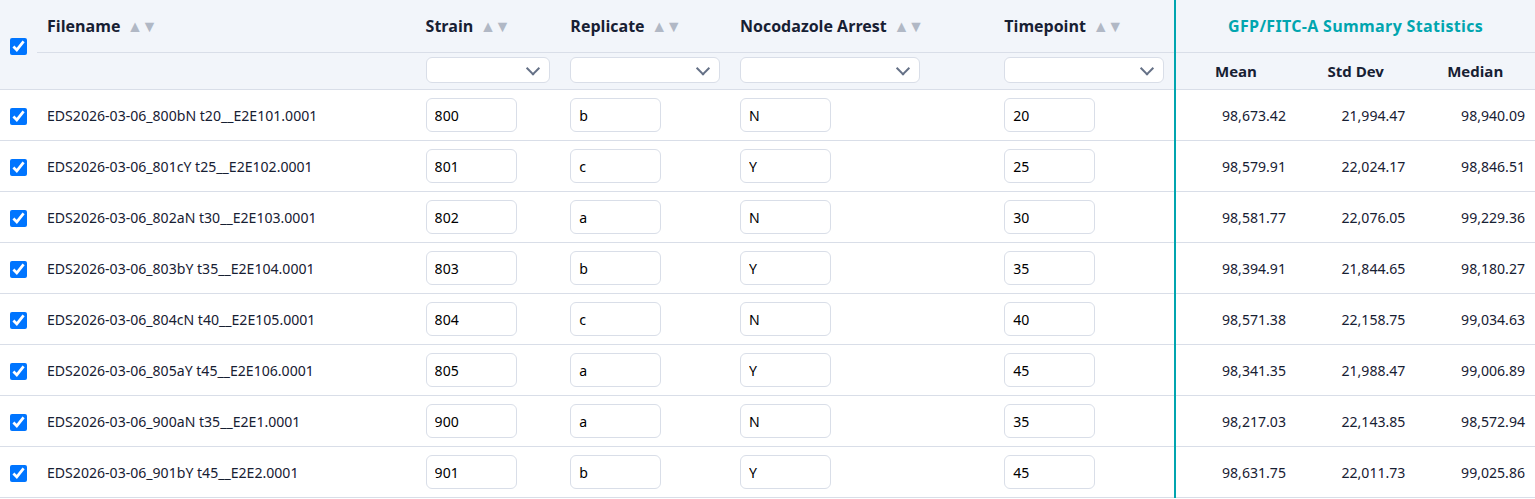
Results are added to the metadata table as grouped columns, such as GFP/FITC-A Summary Statistics spanning Mean, Std Dev, Median, and any other metrics you chose. These columns are included when you export the metadata table.
If you reopen the Calculate Statistics window for a channel that already has statistics, those already-computed metrics are disabled so you do not recompute the same columns. The All checkbox only selects metrics that are still available for that channel.
Statistics are calculated automatically on new FCS file loads
Once you compute a statistic for a channel, PhaseFinder remembers that channel/statistic combination for the rest of the session. Any FCS file you load afterward gets the same statistics calculated automatically and filled into the new row, with no need to reopen the Calculate Statistics window.