Getting Started
Learn the workspace, load FCS files, choose a channel, and follow a typical analysis workflow.
1. Overview
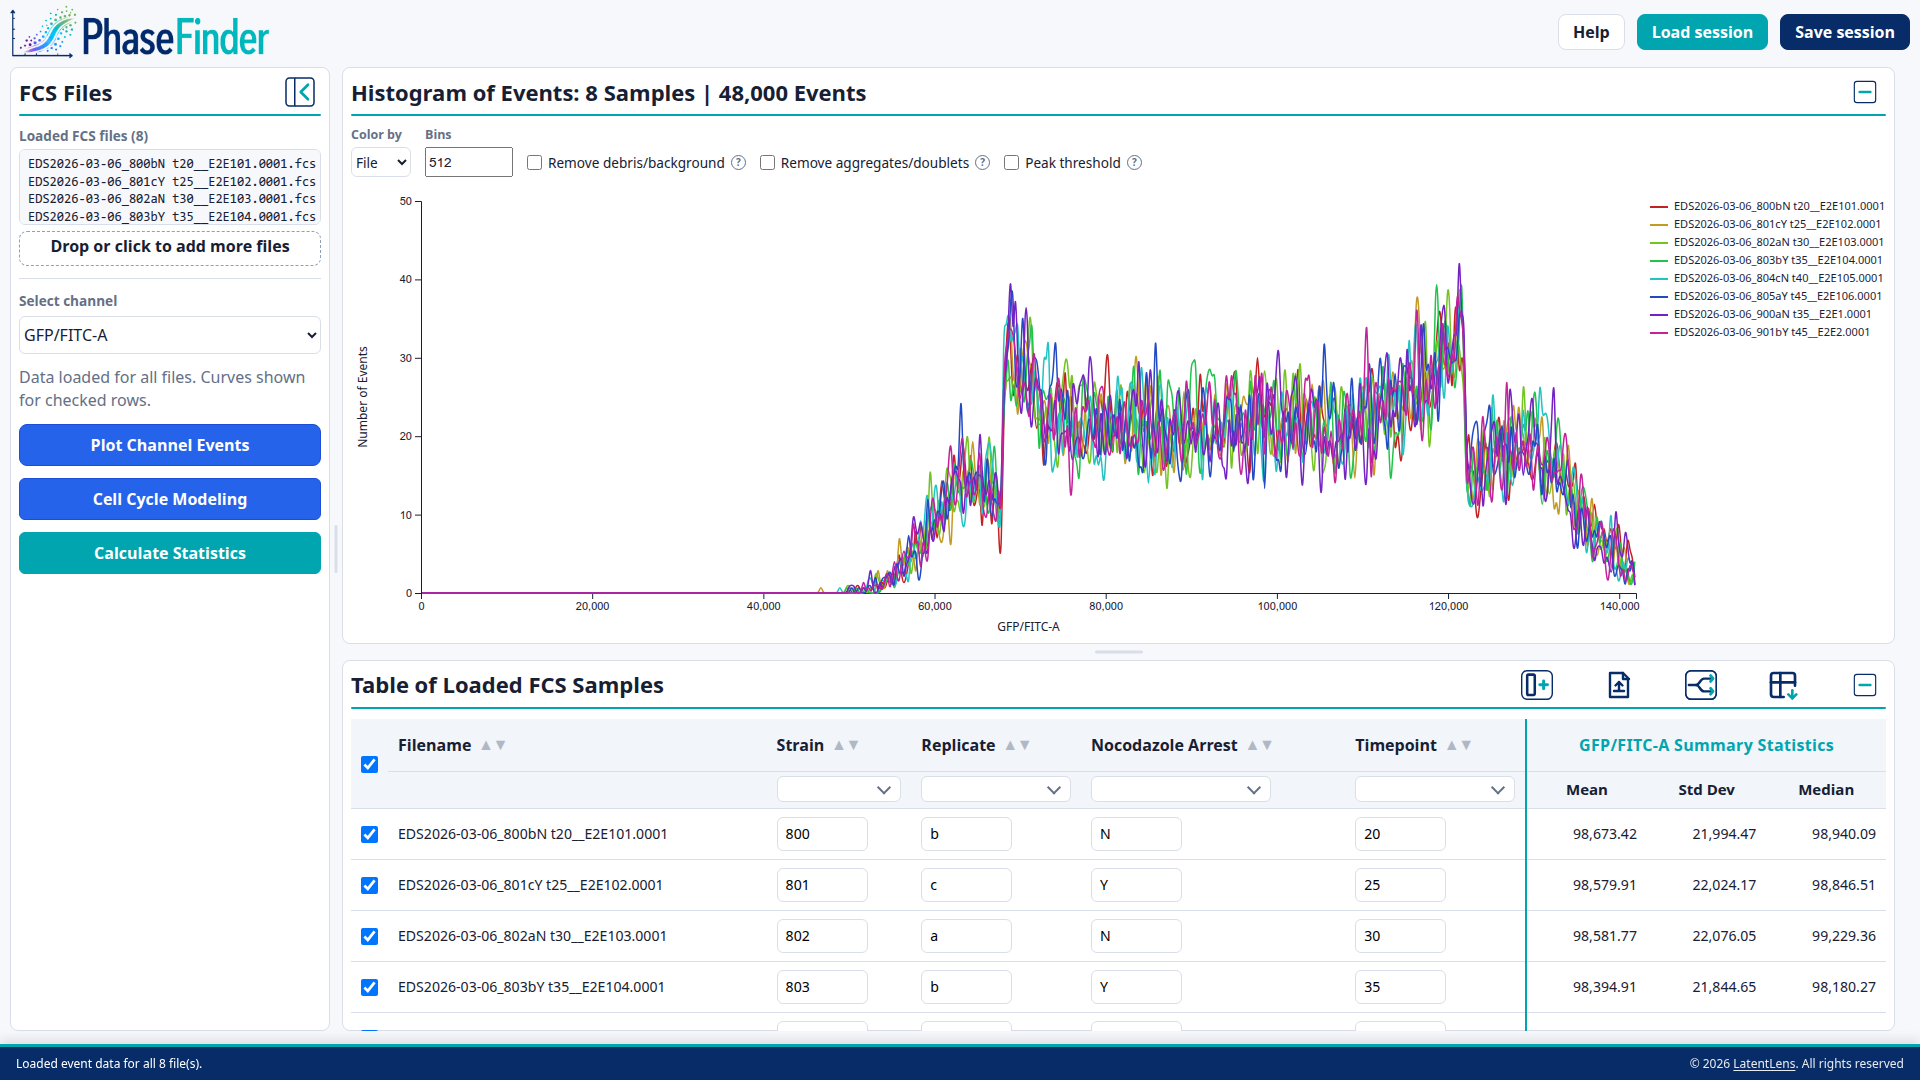
PhaseFinder's screen is organized into these areas:
- Sidebar (left) — drop zone for FCS files, the DNA-content channel selector, and the main action buttons (Plot Channel Events, Cell Cycle Modeling, Calculate Statistics). Cell Cycle Modeling switches the sidebar into a modeling view that holds the Pre-modeling QC filters, the Identify Peaks panel, and the Model & Fit controls; Back returns it to the file/channel controls.
- Plot panel (top of the workspace) — appears once you plot a channel; shows the overlaid event histogram, its controls, and (once modeling starts) the DJF fit overlay and results table.
- Metadata table panel (bottom of the workspace) — one row per loaded FCS file with editable annotations, sorting, filtering, and optional summary-statistics columns.
- Header (top) — the PhaseFinder logo plus Help, Load session, and Save session.
- Status bar (bottom) — progress, completion messages, warnings, and copyright information.
The header also has Load session and Save session buttons for saving your work to a file and restoring it later (see Saving & Loading Sessions).
 Header and session buttons
Plot panel
Metadata table panel
Status bar
Header and session buttons
Plot panel
Metadata table panel
Status bar
- Header and session buttons: open help, load a saved session, or save the current session.
- Sidebar: load files, select a channel, plot, model, and calculate statistics.
- Plot panel: view histograms and plot controls for the selected channel.
- Metadata table panel: edit annotations, filter/sort samples, export TSV data, and review statistics.
- Status bar: read progress, warnings, and completion messages.
Everything lives in memory
PhaseFinder keeps all loaded files, annotations, selections, and plots in the browser tab's memory only. Reloading or closing the page clears everything. Use Save session before you navigate away if you want to pick up where you left off.
2. Loading FCS Files
Load one or more .fcs files by either:
- Dragging them onto the Drop FCS files here zone in the sidebar, or
- Clicking the drop zone to open a file picker.
PhaseFinder reads only each file's header and metadata (TEXT segment) at load time, so adding many files is fast — the actual event data for a channel is only read once you plot or compute statistics on it.
- Files that duplicate an already-loaded filename are rejected with a status message; nothing is re-loaded.
- Newly loaded files appear checked (included) in the metadata table by default — unless a plot already exists, in which case new files start unchecked so they don't unexpectedly change an existing plot.
- The sidebar shows a running Loaded FCS files (N) list once at least one file is loaded.
- A progress overlay reports read progress for larger batches of files.
If you collapse the sidebar (see Layout Controls), a compact icon rail still lets you drop or browse for more files , change the channel , plot , model , and calculate statistics .
'%20xmlns:inkscape='http://www.inkscape.org/namespaces/inkscape'%20xmlns:sodipodi='http://sodipodi.sourceforge.net/DTD/sodipodi-0.dtd'%20xmlns='http://www.w3.org/2000/svg'%20xmlns:svg='http://www.w3.org/2000/svg'%3e%3csodipodi:namedview%20id='namedview1'%20pagecolor='%23ffffff'%20bordercolor='%23000000'%20borderopacity='0.25'%20inkscape:showpageshadow='2'%20inkscape:pageopacity='0.0'%20inkscape:pagecheckerboard='0'%20inkscape:deskcolor='%23d1d1d1'%20inkscape:zoom='26.59375'%20inkscape:cx='16.018801'%20inkscape:cy='16'%20inkscape:window-width='1920'%20inkscape:window-height='1111'%20inkscape:window-x='1911'%20inkscape:window-y='-9'%20inkscape:window-maximized='1'%20inkscape:current-layer='svg2'%20/%3e%3cdefs%20id='defs2'%20/%3e%3c!--%20Icon%20adapted%20from%20Tabler%20Icons%20by%20Pawel%20Kuna%20-%20https://github.com/tabler/tabler-icons/blob/master/LICENSE%20--%3e%3cg%20id='g1'%3e%3cpath%20d='M%2014,3%20V%207%20A%201,1%200%200%200%2015,8%20H%2019'%20id='path1'%20style='fill:none;stroke:%23072c67;stroke-width:0.8625;stroke-linecap:round;stroke-linejoin:round;stroke-opacity:1;fill-opacity:1;stroke-dasharray:none'%20/%3e%3cpath%20d='M%2017,21%20H%207%20A%202,2%200%200%201%205,19%20V%205%20A%202,2%200%200%201%207,3%20h%207%20l%205,5%20v%2011%20a%202,2%200%200%201%20-2,2%20z'%20id='path2'%20style='fill:none;stroke:%23072c67;stroke-width:0.8625;stroke-linecap:round;stroke-linejoin:round;stroke-opacity:1;fill-opacity:1;stroke-dasharray:none'%20/%3e%3c/g%3e%3cpath%20d='M%2012,17.974255%20V%2011.153829%20M%208.5897873,14.564042%2012,11.153829%20l%203.410213,3.410213'%20id='path3'%20style='fill:none;fill-opacity:1;stroke:%2301a5af;stroke-width:1.425;stroke-linecap:round;stroke-linejoin:round;stroke-dasharray:none;stroke-opacity:1'%20/%3e%3c/svg%3e) , change the channel
, change the channel  , plot
 '%3e%3cpath%20d='m%2020,17.970833%20v%202.883334'%20id='path3'%20style='stroke:%2301a5af;stroke-width:1.47054;stroke-linecap:square;stroke-dasharray:none;stroke-opacity:1'%20/%3e%3cpath%20d='m%2016,15.979808%20v%204.865384'%20id='path4'%20style='stroke:%2301a5af;stroke-width:1.47967;stroke-linecap:square;stroke-dasharray:none;stroke-opacity:1'%20/%3e%3cpath%20d='m%2012,12.986184%20v%207.852632'%20id='path5'%20style='stroke:%2301a5af;stroke-width:1.48612;stroke-linecap:square;stroke-dasharray:none;stroke-opacity:1'%20/%3e%3cpath%20d='m%208,15.979808%20v%204.865384'%20id='path6'%20style='stroke:%2301a5af;stroke-width:1.47967;stroke-linecap:square;stroke-dasharray:none;stroke-opacity:1'%20/%3e%3cpath%20d='m%203.1719317,15.082985%20c%205.9437122,0%204.9530935,-8.296394%208.9155683,-8.296394%203.962475,0%202.971856,8.296394%208.915568,8.296394'%20id='path7'%20style='stroke:%2301a5af;stroke-width:1.48044;stroke-dasharray:none;stroke-opacity:1'%20/%3e%3cpath%20d='M%202.9590819,5.5818786%20V%2021.040918%20H%2021.040918'%20id='path2'%20style='stroke:%23072c67;stroke-width:1.06816;stroke-dasharray:none;stroke-opacity:1'%20/%3e%3c/g%3e%3c/svg%3e) , model
, model '%20xmlns:inkscape='http://www.inkscape.org/namespaces/inkscape'%20xmlns:sodipodi='http://sodipodi.sourceforge.net/DTD/sodipodi-0.dtd'%20xmlns='http://www.w3.org/2000/svg'%20xmlns:svg='http://www.w3.org/2000/svg'%3e%3cdefs%20id='defs6'%20/%3e%3csodipodi:namedview%20id='namedview6'%20pagecolor='%23ffffff'%20bordercolor='%23000000'%20borderopacity='0.25'%20inkscape:showpageshadow='2'%20inkscape:pageopacity='0.0'%20inkscape:pagecheckerboard='0'%20inkscape:deskcolor='%23d1d1d1'%20inkscape:zoom='35.458333'%20inkscape:cx='8.3760282'%20inkscape:cy='7.3748531'%20inkscape:window-width='1920'%20inkscape:window-height='1111'%20inkscape:window-x='1911'%20inkscape:window-y='-9'%20inkscape:window-maximized='1'%20inkscape:current-layer='svg6'%20/%3e%3c!--%20f%20--%3e%3c!--%20(%20--%3e%3c!--%20x%20--%3e%3c!--%20)%20--%3e%3cg%20id='g8'%20transform='translate(-3.5967979,-5.125)'%3e%3cpath%20d='m%204.5,19%20c%201.4,0%202.1,-1.2%202.4,-3%20L%208.1,9%20C%208.4,7%209.2,6%2010.6,6'%20id='path1'%20style='stroke:%232dc4b5;stroke-opacity:1'%20/%3e%3cpath%20d='m%205.8,11%20h%204.5'%20id='path2'%20style='stroke:%232dc4b5;stroke-opacity:1'%20/%3e%3c/g%3e%3cg%20id='g7'%20transform='translate(-4.1326382,-2.625)'%3e%3cpath%20d='m%2014.430666,7.5%20c%20-1.1,1.2%20-1.7,2.7%20-1.7,4.5%200,1.8%200.6,3.3%201.7,4.5'%20id='path3'%20/%3e%3cg%20id='g6'%20transform='translate(0.465333)'%3e%3cpath%20d='m%2015.3,10%203.1,4'%20id='path4'%20/%3e%3cpath%20d='m%2018.4,10%20-3.1,4'%20id='path5'%20/%3e%3c/g%3e%3cpath%20d='m%2020.2,7.5%20c%201.1,1.2%201.7,2.7%201.7,4.5%200,1.8%20-0.6,3.3%20-1.7,4.5'%20id='path6'%20/%3e%3c/g%3e%3cpath%20d='m%2010.269826,4.875%20c%20-1.1000003,1.2%20-1.7000003,2.7%20-1.7000003,4.5%200,1.8%200.6,3.3%201.7000003,4.5'%20id='path11'%20style='stroke:%230d2b6f;stroke-opacity:1'%20/%3e%3cg%20id='g13'%20transform='translate(-3.6955073,-2.625)'%20style='stroke:%230d2b6f;stroke-opacity:1'%3e%3cpath%20d='m%2015.3,10%203.1,4'%20id='path12'%20style='stroke:%230d2b6f;stroke-opacity:1'%20/%3e%3cpath%20d='m%2018.4,10%20-3.1,4'%20id='path13'%20style='stroke:%230d2b6f;stroke-opacity:1'%20/%3e%3c/g%3e%3cpath%20d='m%2016.03916,4.875%20c%201.1,1.2%201.7,2.7%201.7,4.5%200,1.8%20-0.6,3.3%20-1.7,4.5'%20id='path14'%20style='stroke:%230d2b6f;stroke-opacity:1'%20/%3e%3c/svg%3e) , and calculate statistics
, and calculate statistics '%20xmlns:inkscape='http://www.inkscape.org/namespaces/inkscape'%20xmlns:sodipodi='http://sodipodi.sourceforge.net/DTD/sodipodi-0.dtd'%20xmlns='http://www.w3.org/2000/svg'%20xmlns:svg='http://www.w3.org/2000/svg'%3e%3cdefs%20id='defs9'%20/%3e%3csodipodi:namedview%20id='namedview9'%20pagecolor='%23ffffff'%20bordercolor='%23000000'%20borderopacity='0.25'%20inkscape:showpageshadow='2'%20inkscape:pageopacity='0.0'%20inkscape:pagecheckerboard='0'%20inkscape:deskcolor='%23d1d1d1'%20inkscape:zoom='35.458333'%20inkscape:cx='8.9964747'%20inkscape:cy='9.9976498'%20inkscape:window-width='1920'%20inkscape:window-height='1111'%20inkscape:window-x='1911'%20inkscape:window-y='-9'%20inkscape:window-maximized='1'%20inkscape:current-layer='svg9'%20/%3e%3cg%20id='g9'%20transform='translate(-3,-2)'%3e%3cpath%20d='M%204,5%20A%202,2%200%200%201%206,3%20h%2012%20a%202,2%200%200%201%202,2%20v%2014%20a%202,2%200%200%201%20-2,2%20H%206%20A%202,2%200%200%201%204,19%20V%205'%20id='path2'%20style='stroke:%23072c67;stroke-opacity:1'%20/%3e%3cpath%20d='M%208,8%20A%201,1%200%200%201%209,7%20h%206%20a%201,1%200%200%201%201,1%20v%201%20a%201,1%200%200%201%20-1,1%20H%209%20A%201,1%200%200%201%208,9%20V%208'%20id='path3'%20style='stroke:%2301a5af;stroke-opacity:1'%20/%3e%3cpath%20d='m%208,14%20v%200.01'%20id='path4'%20style='stroke:%2301a5af;stroke-opacity:1'%20/%3e%3cpath%20d='m%2012,14%20v%200.01'%20id='path5'%20style='stroke:%2301a5af;stroke-opacity:1'%20/%3e%3cpath%20d='m%2016,14%20v%200.01'%20id='path6'%20style='stroke:%2301a5af;stroke-opacity:1'%20/%3e%3cpath%20d='m%208,17%20v%200.01'%20id='path7'%20style='stroke:%2301a5af;stroke-opacity:1'%20/%3e%3cpath%20d='m%2012,17%20v%200.01'%20id='path8'%20style='stroke:%2301a5af;stroke-opacity:1'%20/%3e%3cpath%20d='m%2016,17%20v%200.01'%20id='path9'%20style='stroke:%2301a5af;stroke-opacity:1'%20/%3e%3c/g%3e%3c/svg%3e) .
.4. Choosing a Channel
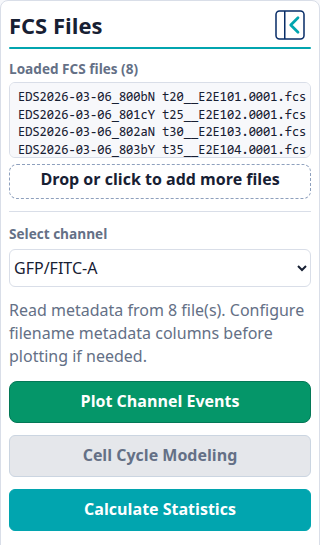
The Select channel dropdown lists every FCS parameter label seen across all loaded files. In an FCS file, each parameter can have several pieces of metadata. PhaseFinder uses $PnS first because it is usually the user-facing stain or signal label, falls back to $PnN when $PnS is missing, and finally generates a generic P<n> label if neither value is available.
PhaseFinder guesses a likely DNA-content area channel automatically (looking for names containing patterns like DAPI_A, DNA_A, or ending in _A/AREA) and pre-selects it when possible — check that the suggestion is right before plotting.
Plot Channel Events stays disabled until at least one file is loaded and a channel is chosen.
If you change the channel after already plotting, PhaseFinder preloads the newly selected channel's data in the background and clears the old curves. Click Plot Channel Events when you are ready to switch the visible plot explicitly.
11. Typical Workflow
- Navigate to PhaseFinder in a browser: https://PhaseFinder.LatentLens.org.
- Drop your
.fcsfiles onto the drop zone, or click the drop zone to browse and choose files. - Wait for metadata loading to finish; watch the progress overlay for large batches.
- When the filename metadata wizard pops up, configure split steps so your filenames map cleanly onto Strain / Replicate / Nocodazole Arrest / Timepoint (or whatever columns make sense for your experiment), check the live preview, then click Apply.
- Review and hand-edit any annotations the wizard couldn't infer, using the table's sort and filter controls to spot-check groups of samples.
- Confirm (or change) the DNA-content channel in the sidebar.
- Check the rows you want in the plot — unchecking removes a sample without losing its already-loaded data.
- Click Plot Channel Events. Adjust Color by, Display, and Bins.
- Click Cell Cycle Modeling to open the modeling controls in the sidebar. Apply the Pre-modeling QC filters you want, then use Identify Peaks to detect and, if needed, adjust the G1 and G2/M peak regions for the sample you're reviewing.
- Optionally, use Calculate Statistics to compute per-file summary statistics for any channel, and export the table to TSV for use elsewhere.
- Click Save session before closing the tab so you (or a collaborator) can resume this same analysis later.